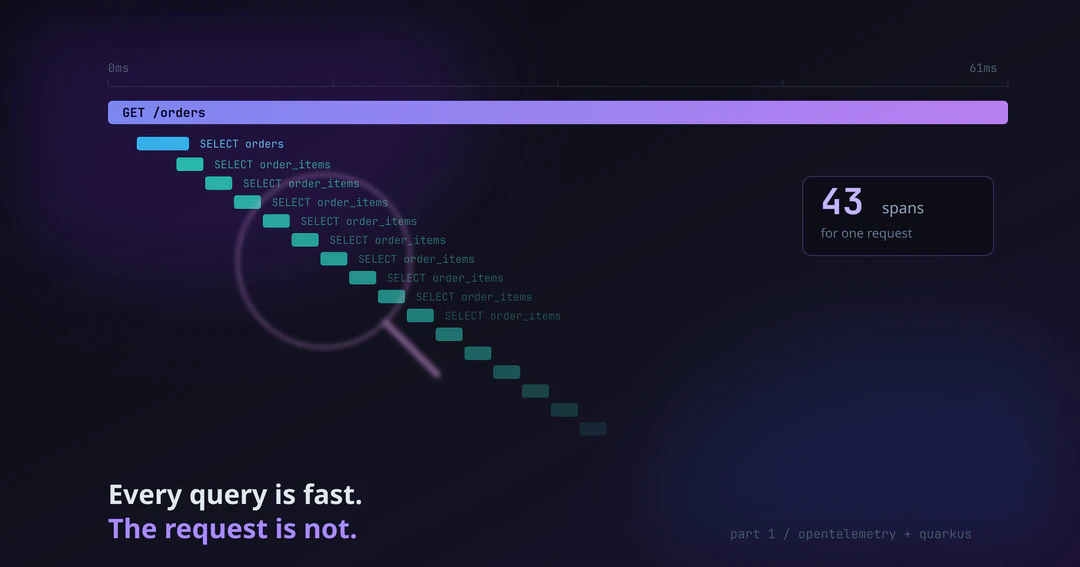
Part 1 of 2. The goal here is to convince you to instrument, and to show the shortest path to it, with a single service. Part 2 takes the same system, spreads it across five services and four languages, and then digs into what changes in production.
Every number came from measurements in the observability-arena repo.
The ticket nobody can answer
It is 2:32 pm on a Tuesday. A customer opens a ticket: “checkout is stuck.”
You have dashboards. Infrastructure is green. Application latency is within range. The frontend team is certain the API is at fault. The backend team shows a chart where nothing moved. The payments team opens their panel and points out, correctly, that their error rate is zero.
Three teams, three dashboards, three conclusions, all pointing at somebody else. And the customer is still waiting.
This article is about the difference between having data and being able to answer questions.
Why this became the market standard
On 21 May 2026, OpenTelemetry graduated from the CNCF. That ended a debate which had consumed years of architecture meetings: which telemetry standard to adopt.
The answer is boring now, and boring is exactly the point. OpenTelemetry is the standard. The JavaScript package passed 1.36 billion downloads in twelve months, Python passed 1.3 billion. There is no decision left to make here, only implementation.
Three things shifted alongside the graduation, and they explain why 2026 is not 2023:
Profiles became the fourth signal. Metrics, logs and traces stopped being “the three pillars”. Execution profiles joined the conversation, and modern tooling correlates all four.
eBPF made instrumentation optional for the basics. You can instrument HTTP, database and network without touching code. The current practice is hybrid: zero-code at the perimeter, manual instrumentation for the business context only you know about.
Cost became an engineering problem. Telemetry grows faster than the system it observes. Left unchecked it becomes one of the largest lines on a cloud bill, and the answer is not “sample less”, as we will see.
What enterprises get wrong
The most common mistake in a company is not technical, it is organisational: every application exports telemetry straight to the observability backend.
That works in a tutorial. In a company with forty services, it means:
- changing the sampling policy is a ticket for forty teams
- switching vendors is a migration project
- one piece of sensitive data leaking into a trace has to be fixed in forty repositories
- nobody can make a decision that depends on seeing a whole trace
The pattern the industry settled on is different:
Applications never talk to the backend. They talk to a local collector. Policy lives in exactly one place. This is not architectural fussiness: it is the difference between “let us change the sampling” being four lines of YAML or being a quarter.
The minimum vocabulary
Four terms and one mechanism. Skip ahead if you already live in this world.
The four signals
The useful question is not “what is each one”, it is which question each one answers:
| Signal | Answers | Cardinality |
|---|---|---|
| Metric | how many, how fast, is it getting worse? | must be low |
| Log | what happened on this line of code? | free |
| Trace | where did this request go, and where did the time go? | free |
| Profile | which lines of code burned CPU? | n/a |
A metric tells you a problem exists, a trace tells you where, a log tells you what, a profile tells you why. Anyone with only metrics stops on the first step, and that is where most companies are.
Trace, span and propagation
A span is a unit of work with a start, an end and a name. A trace is the tree of
spans for one whole request, and the parent/child relationship is what draws the
waterfall you see in the screenshots here. Every span carries attributes:
order.id=1019, db.system=postgresql. High cardinality is welcome here, because each
span is an individual event.
The mechanism holding it together is simpler than it looks. When one service calls another, it sends along a header standardised by the W3C:
The receiving service reads it and creates its spans as children of that span, inside that trace. That is all. No coordination, no shared database, no central registry: one 55 character string travelling with the request.
That is why it works identically across Java, Go, .NET and Node. And it is why it fails in silence: without the header, the next service starts a brand new trace, and nothing raises an error.
MDC, the context on the logging side
MDC (Mapped Diagnostic Context) is a key/value map attached to the current thread. Everything logged from that point on carries those fields automatically.
Without MDC, you repeat the identifier in every log statement and forget it in exactly the one that mattered. With it, you declare once:
MDC.put("order.id", String.valueOf(order.id));
And every line after that carries the field, including lines written by code that has never heard of an order.
| Span attribute | MDC | |
|---|---|---|
| Attaches to | one span | every log line downstream |
| Queried with | TraceQL | LogQL |
The detail that ties it together: trace_id and span_id are already in the MDC,
put there by the OpenTelemetry extension. That is the mechanism behind every
log-to-trace jump in this article.
One rule that costs you to learn the hard way: remove the entry in a finally. Threads
are pooled, and a forgotten MDC entry sticks one customer’s order onto the next
customer’s request.
Cardinality and sampling
Cardinality is how many distinct values a field can take. order.status has three,
order.id has infinite. Irrelevant for traces and logs, decisive for metrics: every
label combination becomes a time series occupying memory and disk for the whole
retention window. Part 2 measures the
damage.
Sampling comes in two shapes. Head sampling decides at the start, before knowing what will happen, and throws away errors in the same proportion as ordinary requests. Tail sampling waits for the trace to finish and can weigh duration and status, which allows “keep 100% of errors and 10% of the rest”. The second only works at a point that sees the complete trace, and that changes the shape of the plumbing.
Why “CNCF” changes anything
Graduating from the CNCF is not a marketing badge: the criteria are public and verifiable, including documented production adopters, governance independent of any single company, and a security audit.
What that buys in practice, and it is the argument that convinces whoever signs off:
Your instrumentation stops being a vendor contract. The code that produces spans mentions no backend at all. Switching vendors becomes changing an export endpoint, not reinstrumenting forty services. Anyone who has migrated off a proprietary APM knows what that is worth.
Worth being clear about where this stack is not CNCF: Grafana, Loki and Tempo are Grafana Labs projects under AGPL. Excellent, and not neutral in the same way. Part 2 closes that gap with Perses.
What Quarkus gives you, and why it starts ahead
One command, and the whole stack is up
cd services/orders-api
quarkus dev
That is it. Dev Services bring up Postgres, Kafka and the entire Grafana stack (Grafana,
Loki, Prometheus, Tempo, Pyroscope and an OpenTelemetry Collector) through
Testcontainers. You write no docker-compose.yml and configure nothing.
One catch that costs time: the quarkus-observability-devservices extension on its own
starts nothing. The Dev Service only activates when there is at least one dev resource
on the classpath:
<dependency>
    <groupId>io.quarkus</groupId>
    <artifactId>quarkus-observability-devservices-lgtm</artifactId>
    <scope>provided</scope>
</dependency>
Grafana gets an ephemeral port, printed in the log:
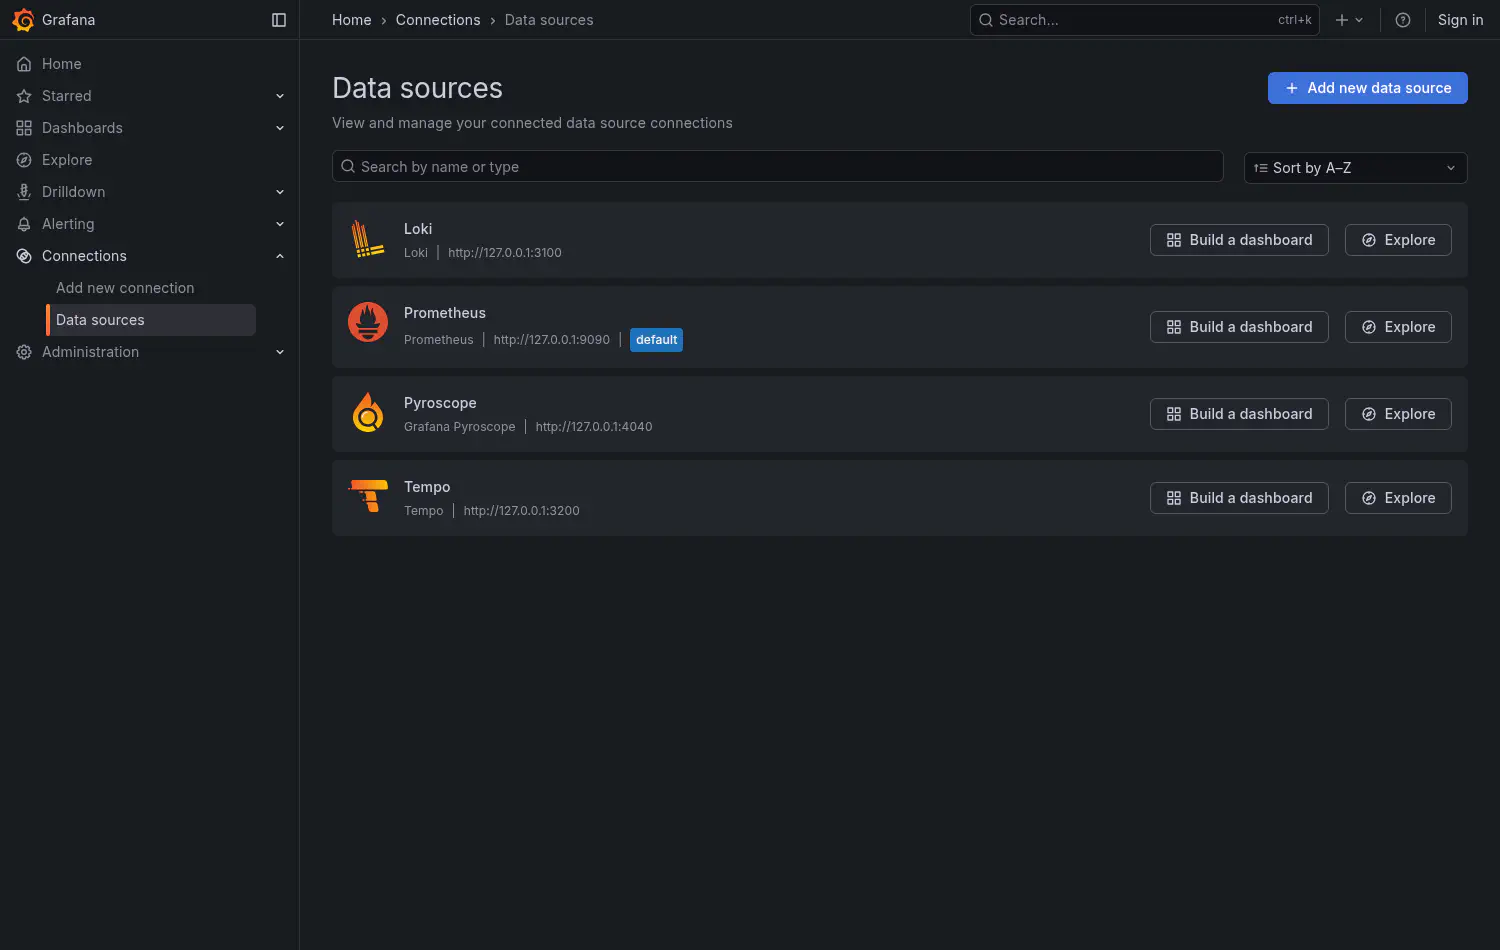
Four datasources configured without opening a settings screen. Note Pyroscope sitting there: the fourth signal came along, and most people never find out it is available.
Three signals with one extension
<dependency>
    <groupId>io.quarkus</groupId>
    <artifactId>quarkus-micrometer-opentelemetry</artifactId>
</dependency>
The documentation is direct: “All signals are enabled by default”. Traces, metrics and logs ship together.
Worth knowing: with plain quarkus-opentelemetry, metrics and logs are tech preview and
come disabled. The Micrometer bridge turns all three on without being asked.
And one contrast with the Spring world worth highlighting: the OpenTelemetry Java agent
is neither required nor recommended on Quarkus. The extensions instrument at build
time. No -javaagent, no extra cold start, no surprises in native image.
The most important line in the file
quarkus.datasource.jdbc.telemetry=true
Without it, queries never become spans. The trace shows GET /orders with a total
duration, which is exactly what the latency metric already told you. With it, you see
what Hibernate actually did.
Demo: the N+1 nobody sees in the code
orders-api has two endpoints returning byte-identical JSON:
@GET
@Transactional
public List<OrderSummary> listNaive() {
    return Order.<Order>listAll(Sort.by("id")).stream()
            .map(OrderResource::summarize)
            .toList();
}

@GET
@Path("/optimized")
@Transactional
public List<OrderSummary> listOptimized() {
    return Order.find("select distinct o from Order o left join fetch o.items order by o.id")
            .list().stream()
            .map(OrderResource::summarize)
            .toList();
}
Measured with k6:
The metric stops here. It says one endpoint is slower, and nothing about why.
How you would solve this without OpenTelemetry
The detour is worth taking, because it is what shows the size of the gain.
You would turn on SQL logging and reproduce:
quarkus.hibernate-orm.log.sql=true
Notice what that sentence already cost. Change configuration and restart, which in production means a deploy, or reproduce in staging and hope the data volume is comparable. The problem that shows up with forty orders disappears with three.
Then you look at the console and find what you expected: a wall of repeated select
statements. And now comes the hard part.
The log does not know which request each line belongs to. With ten concurrent users, the queries from all ten arrive interleaved in the same console with nothing separating them. You cannot count how many belonged to one request, which is precisely the number that matters. What is left is measuring one request at a time in a controlled environment, which is no longer debugging production.
And the closing question would still be missing: how much of the total time was the
database? SQL logging times nothing. For that you would reach for a profiler, or
p6spy, or hand-rolled timing around the repository.
Add it up: a configuration change, a restart, a reproducible environment, isolated traffic, and a second tool to get timings. Compared to opening the trace of a request that already happened, in production, with everybody using the system.
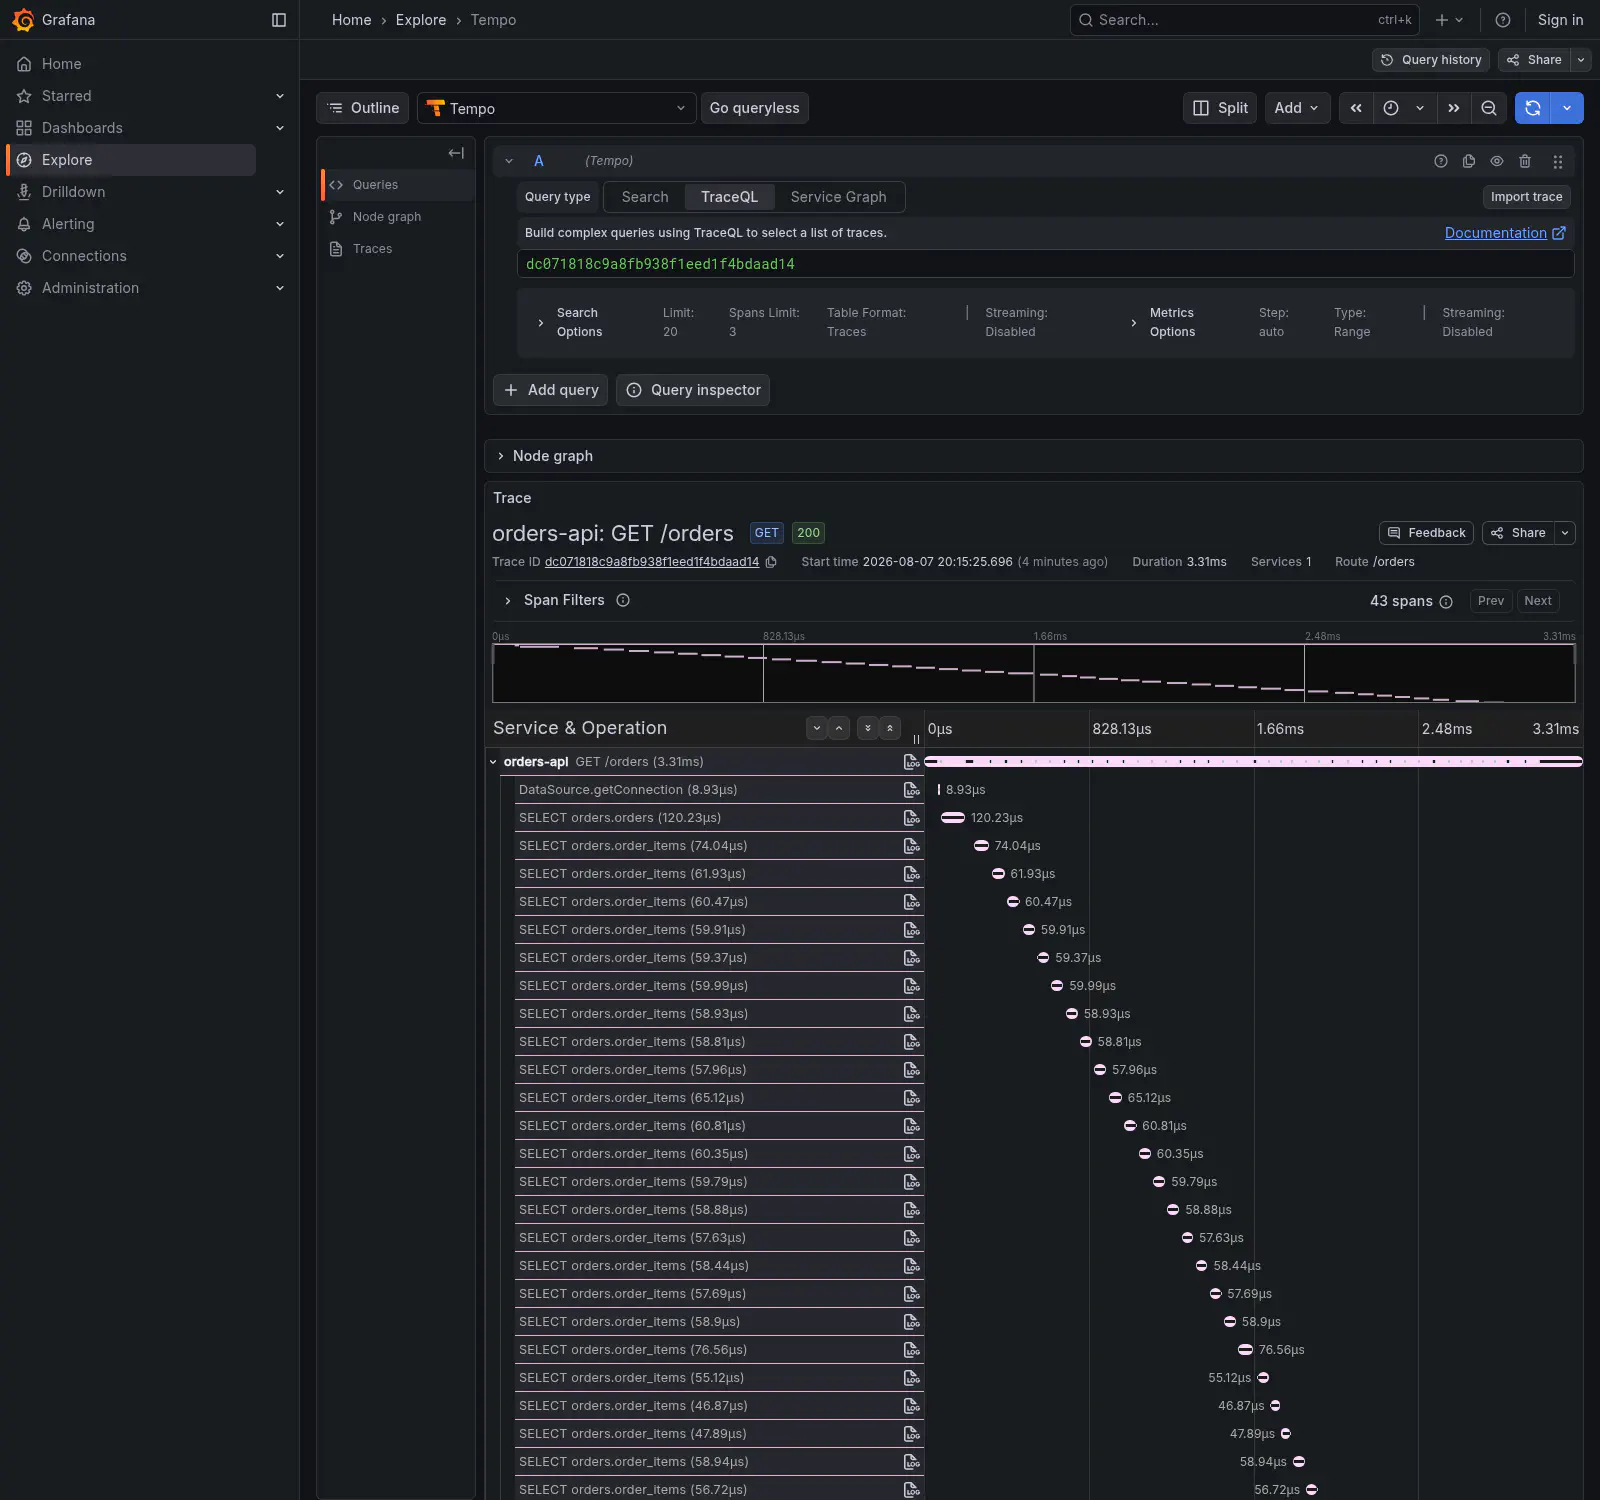
Look at the right corner: 43 spans. And at the ladder of SELECT orders.order_items
marching down the screen, each one taking its 60 microseconds. None of them is slow.
Together, they are the problem. No latency metric could ever draw that.
And the same JSON, through the endpoint that uses join fetch:
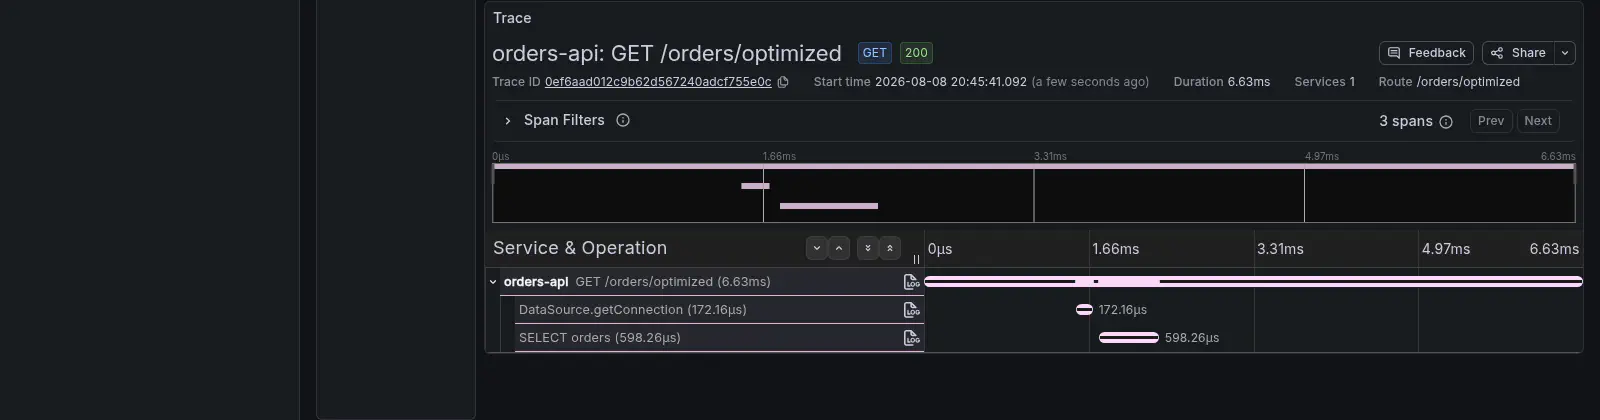
3 spans against 43. One SELECT orders taking 598 microseconds, one connection
acquisition, done. Both endpoints return identical bytes and have comparable amounts of
code.
The difference between those two images is the whole argument of this article. It is not that one is faster, the metric already said that. It is that the structure of the work becomes visible, and with it the cause.
Before you conclude the wrong thing about Quarkus, a warning: those 43 spans are not
the default behaviour. The demo disables a protection on purpose, with
quarkus.hibernate-orm.fetch.batch-size=1, so the scenario shows up in full.
With the default, that same listAll over 40 orders does not fire 41 queries, it fires
4: Quarkus enables batch fetching with size 16, and the 40 lazy loads collapse
into 3 queries with IN (...) plus the query for the orders themselves.
And that is exactly where the lesson lives: a default protection you do not know you
have is one you will not notice losing. Somebody lowers batch-size during a tuning
pass, no test fails, no log complains, and latency creeps up in silence. You only find
out by opening a trace, which is the entire argument of this article.
Manual instrumentation: annotations before API
When auto-instrumentation does not cover something, the Quarkus documentation is direct about the order of preference, and it bears repeating: “use manual instrumentation if there is no alternative, because it requires more maintenance work”.
Before writing code against the API, there are two annotations:
@WithSpan("reserve stock")              // creates a new span
public Reservation reserve(@SpanAttribute("sku") String sku) { ... }

@AddingSpanAttributes                   // does NOT create a span, only adds attributes
public void enrich(@SpanAttribute("tenant") String tenant) { ... }
The difference between them is where most people get it wrong. @WithSpan always
creates a new span, and the docs warn explicitly: do not use it on REST endpoints,
because they are already instrumented and you end up with a duplicate span nested inside
the other. @AddingSpanAttributes is the right choice when you only want to enrich the
span that already exists, which is the common case.
If you genuinely need the API, Quarkus injects what the MicroProfile specification
defines: OpenTelemetry, Tracer, Span and Baggage.
Stop tracing what does not matter
This one is small and saves more than it looks:
quarkus.otel.traces.suppress-application-uris=q/health.*
An orchestrator calls the health check every ten seconds, forever. Without this line every call becomes a trace: it buries the traces that matter under noise, spends sampling decisions on nothing, and pays storage for data nobody will ever open.
Measured on the demo, with 25 requests to each endpoint:
Note the format: no leading slash, and .* for subpaths. If you use
quarkus.http.root-path, it has to be included here too.
What is already instrumented (or: stop annotating everything)
Before you start scattering annotations through the code, it is worth knowing what is already covered. And it is more than most people assume.
For traces, instrumentation is switched on by configuration, not by annotation:
quarkus.datasource.jdbc.telemetry            # JDBC
quarkus.otel.instrument.vertx-sql-client     # reactive SQL client
quarkus.otel.instrument.rest                 # REST endpoints
quarkus.otel.instrument.resteasy-client      # REST Client
quarkus.otel.instrument.messaging            # Kafka and friends
quarkus.otel.instrument.grpc                 # gRPC
quarkus.otel.instrument.vertx-http           # HTTP
quarkus.otel.instrument.vertx-event-bus      # Event Bus
quarkus.otel.instrument.vertx-redis-client   # Redis
All defaulting to true. Every data access layer, every outbound call, every consumed
message becomes a span without you writing anything. They exist so you can turn things
off when one of them gets noisy, not to turn them on.
For metrics, same logic, with a single switch:
quarkus.micrometer.binder-enabled-default=true
That turns on JVM, HTTP server and client, Vert.x, Netty, Kafka, the Agroal connection pool and Hibernate ORM in one go, all coming from extensions already on the classpath.
Here lives a trap that costs time: the bridge inverts this default. With plain
quarkus-micrometer the binders are on; with quarkus-micrometer-opentelemetry they are
off. Same family of properties, opposite behaviour, and the symptom is a dashboard that
is simply empty.
The database binders need one more step, because the switch above only decides whether to publish what exists, and collecting statistics is not free:
quarkus.datasource.metrics.enabled=true
quarkus.hibernate-orm.metrics.enabled=true
Measured on the demo, that brought in 45 new metrics with no code: 17 from the connection pool and 28 from Hibernate.
Look closely at agroal_awaiting_count and agroal_blocking_time_average: those are
the metrics that expose a drained pool before anyone opens a trace, and they are how
part 2 catches a cascading failure from the metrics side.
And the Micrometer documentation is direct about annotations:
“Many methods, such as REST endpoint methods or Vert.x routes, are counted and timed by the Micrometer extension by default.”
In other words: @Timed and @Counted on an endpoint are redundant. The extension
already measures all of them, with class, method and exception tags. The annotations
exist for methods that are not endpoints, typically a business rule or an internal
integration you want timed separately.
If you do use @Timed with parameters, @MeterTag extracts a value from an argument as
a tag. And then the warning the docs themselves put in capitals applies:
“Tag values provided MUST BE of LOW CARDINALITY. High cardinality values can cause performance and storage problems in your metrics backend. Tag values must not use end user data.”
That is the cardinality explosion scenario, written in the tool’s own documentation, which does not stop anyone from walking into it.
Two switches deserve attention because they involve sensitive data:
quarkus.otel.traces.eusp.enabled=true        # end user attributes
quarkus.otel.security-events.enabled=true    # security events on spans
The first exports user identification into spans. The docs themselves flag it as personally identifiable information, and telemetry tends to have long retention, broad access and no deletion workflow. Turn it on knowing what you are doing.
Metrics that follow the convention (and the honest limit of that)
The Micrometer bridge exports with Micrometer’s historical naming
(http.server.requests), not OpenTelemetry’s (http.server.request.duration). The
Quarkus documentation says so explicitly.
But that is a default, not a limitation. Quarkus discovers MeterFilter beans and
applies them when the registries initialise:
@Produces
@Singleton
public MeterFilter semanticConventions() {
    return new MeterFilter() {
        @Override
        public Meter.Id map(Meter.Id id) {
            String name = METER_NAMES.getOrDefault(id.getName(), id.getName());
            // ... renames the tags too
            return id.withName(name).replaceTags(tags);
        }
    };
}
What this filter deliberately does NOT rename are the timers, and that omission is
the interesting part. The OTel convention defines http.server.request.duration in
seconds. Micrometer records milliseconds. A MeterFilter rewrites names, it does
not rescale values.
Renaming anyway would produce a metric with a standard name and a non-standard unit, which is strictly worse than an obviously non-standard name: a generic OTel dashboard would read it as seconds and show numbers a thousand times too large, with nothing to indicate the error.
Following a convention halfway is not being half safe.
Profiles: the fourth signal, with a trace id inside
Traditional profiling is something you turn on after the problem showed up, and by then it does not reproduce. Continuous profiling inverts that: the data for the incident already exists, and you open yesterday’s 2:32 pm window.
The cost is lower than intuition suggests, because the mechanism is sampling rather than instrumentation: typically a hundred stack traces per second, a number that does not grow with call volume. It lands between 1% and 3% of CPU with a language SDK, and under 1% with eBPF. Leaving it on permanently in production is standard practice, not daring.
Two things worth separating, because they get conflated: JFR belongs to the JVM, not to Quarkus. It works with no extension at all, and it is what records allocation, GC, lock contention and CPU samples.
The quarkus-jfr extension adds little, and it is fair to say how little. A 178 second
dump under load produced 390 quarkus.Rest events and 23 boot metadata events. Only the
first matters, and this is why:
Precision matters here: the JVM’s profiling events carry no trace id. A
jdk.ExecutionSample has a stack and a thread name, nothing else. What quarkus.Rest
gives you is the tuple (traceId, thread, instant, duration), and with it you filter the
samples from that thread in that window. Without the extension you would have the samples
and no path leading from a trace id to them. It is a bridge, not a tool, and it is the
only real reason to install it.
Reading a recording without becoming an archaeologist
Most people picture JFR as a binary file that needs a GUI. It does not: the JDK ships 97 prepared views that aggregate and format for you.
jfr view hot-methods live.jfr
The ones worth knowing by heart: hot-methods and cpu-time-hot-methods for CPU,
allocation-by-class for garbage, contention-by-class for lock fighting, gc-pauses,
thread-cpu-load, and pinned-threads for a virtual thread pinned to its carrier. And
jfr view types lists everything present in that recording, which is where to start.
Lock contention deserves the spotlight, because it is the case where the trace abandons you: the span simply takes longer, with nothing inside it to explain what.
The finding no other signal gives you
One view in particular justifies the fourth signal existing. Running it on the demo, under load:
jfr view container-cpu-throttling live.jfr
7.5% of CPU slices were throttled by the cgroup. The cause is the cpus: "1.0" limit
in Compose, and the effect is latency smeared across every request.
Now notice what the other three signals say about it: nothing. The trace shows slower spans for no apparent reason. The latency metric rises with no error appearing anywhere. The log has not a single line about it. You have a slower system, three signals agreeing it is slower, and zero explanation.
That is the kind of cause that has teams spending weeks optimising code that was never the problem.
The default is unlimited, and that fills the volume
If you follow the advice to leave it on permanently, you need to know something the
Oracle documentation states and almost nobody reads: maxage and maxsize are zero by
default, meaning unlimited. And disk is on. A continuous recording without both of
them writes forever, to disk, with no ceiling.
The two work together and whichever trips first wins. maxage gives you a
predictable window; maxsize protects you from the allocation spike that produces
fifteen minutes of data in four. Measured here under load, the recording grows at 32 MB
per hour, so the 100 MB ceiling is never reached. Without it, in production, this becomes
a full node disk and evicted pods.
Set both. It is the difference between continuous profiling being sustainable and being a time bomb.
The honest hole in the model
JFR records locally and you read it on demand, which is excellent for cost: nothing leaves the machine, nothing becomes a time series, nothing weighs on the metrics backend.
And that is exactly why it fails in the worst case. A SIGKILL or an OOMKill run nothing,
and the buffer dies with the process. The pod you most wanted to profile is the one that
takes the evidence with it. A streaming profiler, like the Pyroscope used in two of the
other services in the demo, does not have that problem: the sample already left before
things died.
The workarounds, from cheapest to most complete:
Live dump, without stopping the process. This is the normal incident flow, and it
works because the runtime image Quarkus recommends ships jcmd:
jcmd 1 JFR.dump name=continuous filename=/jfr/now.jfr
It does not ship jfr, the reader, and that is correct: you extract the file and open it
with a full JDK or with JDK Mission Control.
dumponexit=true plus a preStop cover orderly shutdown, which is most cases:
deploy, scale down, node drain. Just make sure the grace period fits the dump, otherwise
SIGKILL arrives and you lose both.
A shared volume with a sidecar gets the file off the machine before the pod
disappears. Without it, emptyDir vanishes on reschedule, though it survives a container
restart inside the same pod, which already covers crash loops.
For death by memory, the mechanism is different. No hook runs on an OOMKill, so what
saves you is the JVM writing before it dies, with -XX:+HeapDumpOnOutOfMemoryError
pointing at the shared volume. A heap dump is not a profile, but it answers the question
the profile will not be around to answer.
Neither model wins at everything. Choosing while knowing where each one gives way beats choosing by the name.
What if it is a monolith?
It counts just the same, and the demo proves it without a separate app:
./scripts/build.sh     # the orders-api image comes from Jib, not a Dockerfile
docker compose up
The default profile starts a single service, with the database, the broker and the observability stack. The other four services stay out. Same codebase, and the N+1 scenario keeps working in full without any distributed system involved.
The value does not come from “distributed”, it comes from seeing the internal structure of a request. A 200,000 line monolith needs that as much as a 40 service mesh.
The mistakes that fail in silence
Worth keeping as a checklist before declaring a service instrumented:
| Mistake | Symptom |
|---|---|
jdbc.telemetry off | the trace shows only the total duration |
traceparent missing from CORS | two disconnected traces, no console error |
| propagator not registered (Go) | the service opens a new trace on every request |
| instrumentation import out of order (Node) | empty traces |
build time property under %dev | the endpoint returns [], nothing is logged |
order.id as a label | the metrics backend degrades weeks later |
They all share one signature: nothing breaks, nothing warns, and you find out late.
What to do with this
If you got this far convinced, the next obstacle is thinking you need all of it at once. You do not, and the start is far cheaper than it looks:
One afternoon, one service, traces only. Pick the service where the incidents happen.
Add the extension, set quarkus.datasource.jdbc.telemetry=true, run quarkus dev. You
will see things you did not know about.
Then correlate the logs. Do not write trace_id by hand anywhere: in every stack
that is configuration. When a clickable log leads to a trace, the value becomes obvious to
the whole team, and that is usually when adoption turns.
Notice what is not on the list: there is no “pick a vendor”. After OpenTelemetry graduated from the CNCF, that decision stopped being the first one and became the last, and a reversible one. That is the gift standardisation handed you.
In part 2, the same system becomes five services in four languages, a click in the browser crosses all of them in a single trace, and then we get into what actually changes in production: what it costs, what to sample, and what to alert on.